

Data Analytics & Visualisation
Data Analysis & Visualisation Using Excel (DAVE)
Go beyond basic Excel. Turn raw data into clear analysis and dashboards in 3 weeks of live, practical sessions.
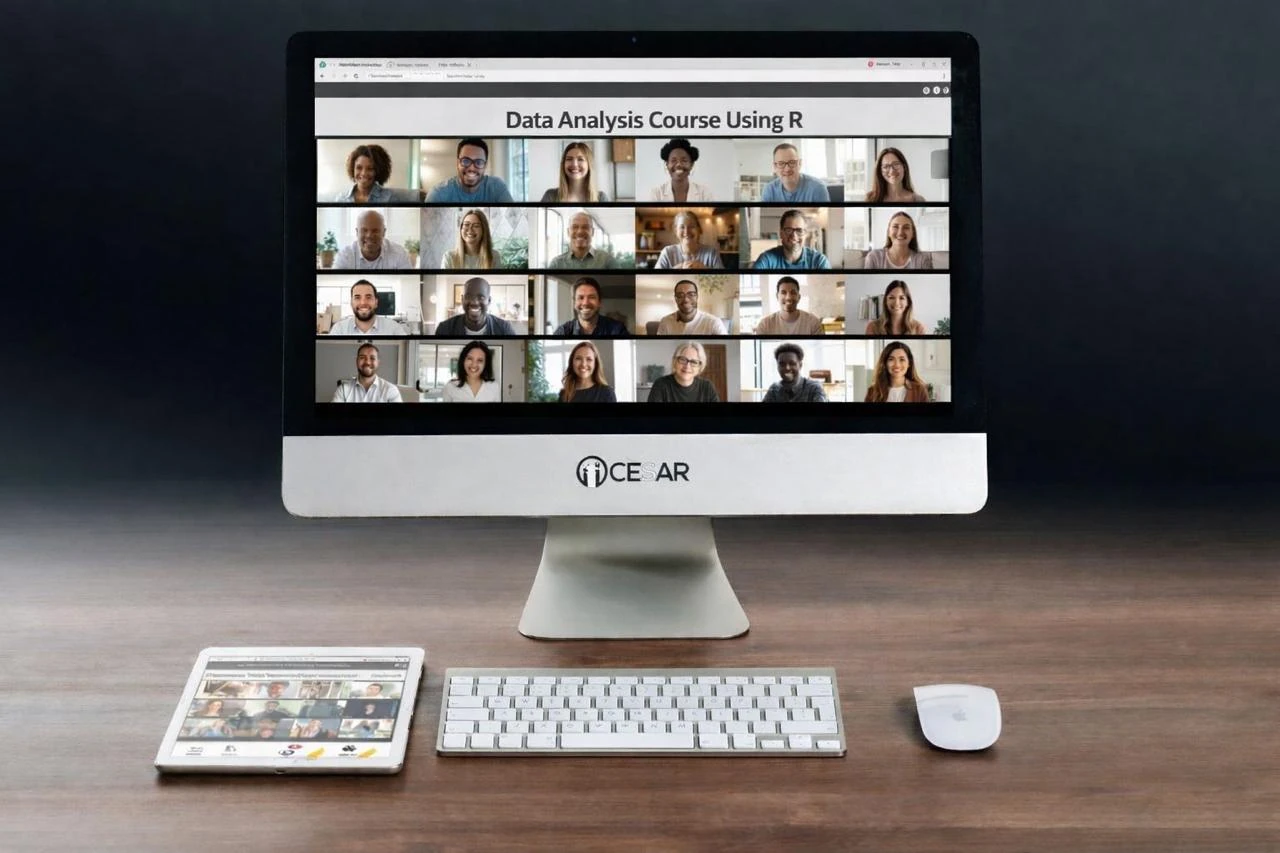
Learn MoreLearn from anywhere, with live interactive sessions.
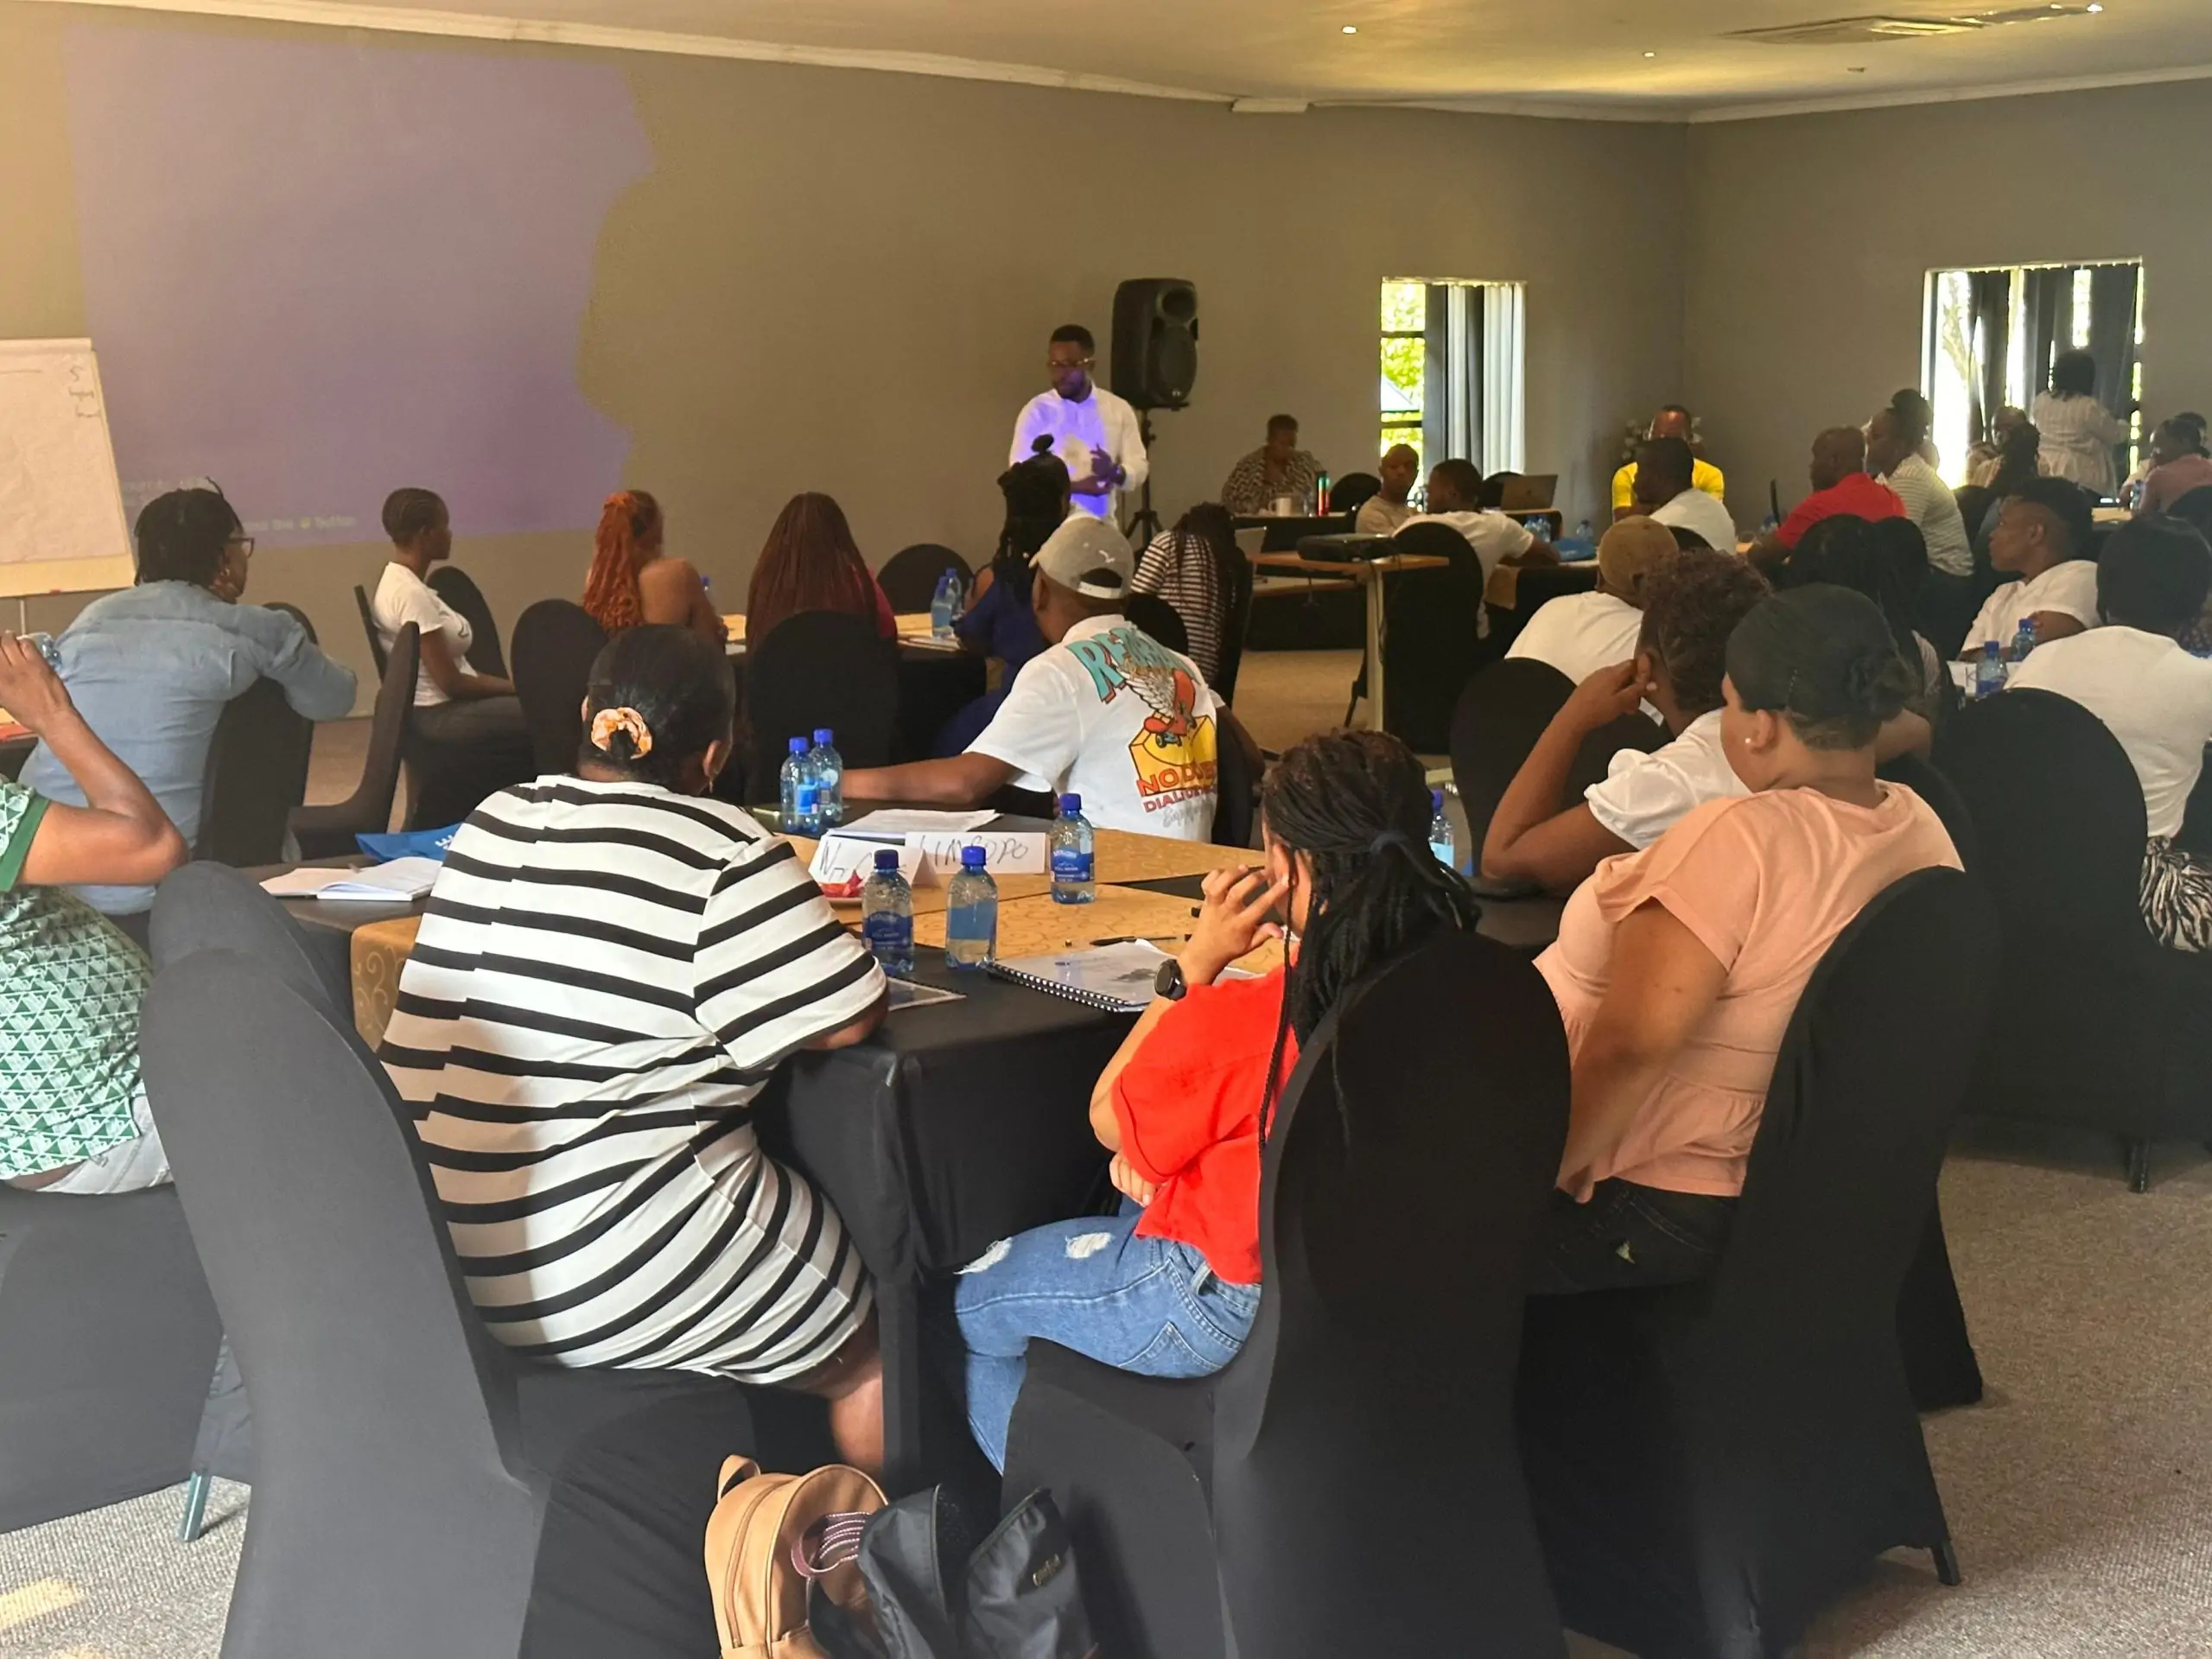
Attend in-person training at our designated locations.
Customised training for your organisation's specific needs.
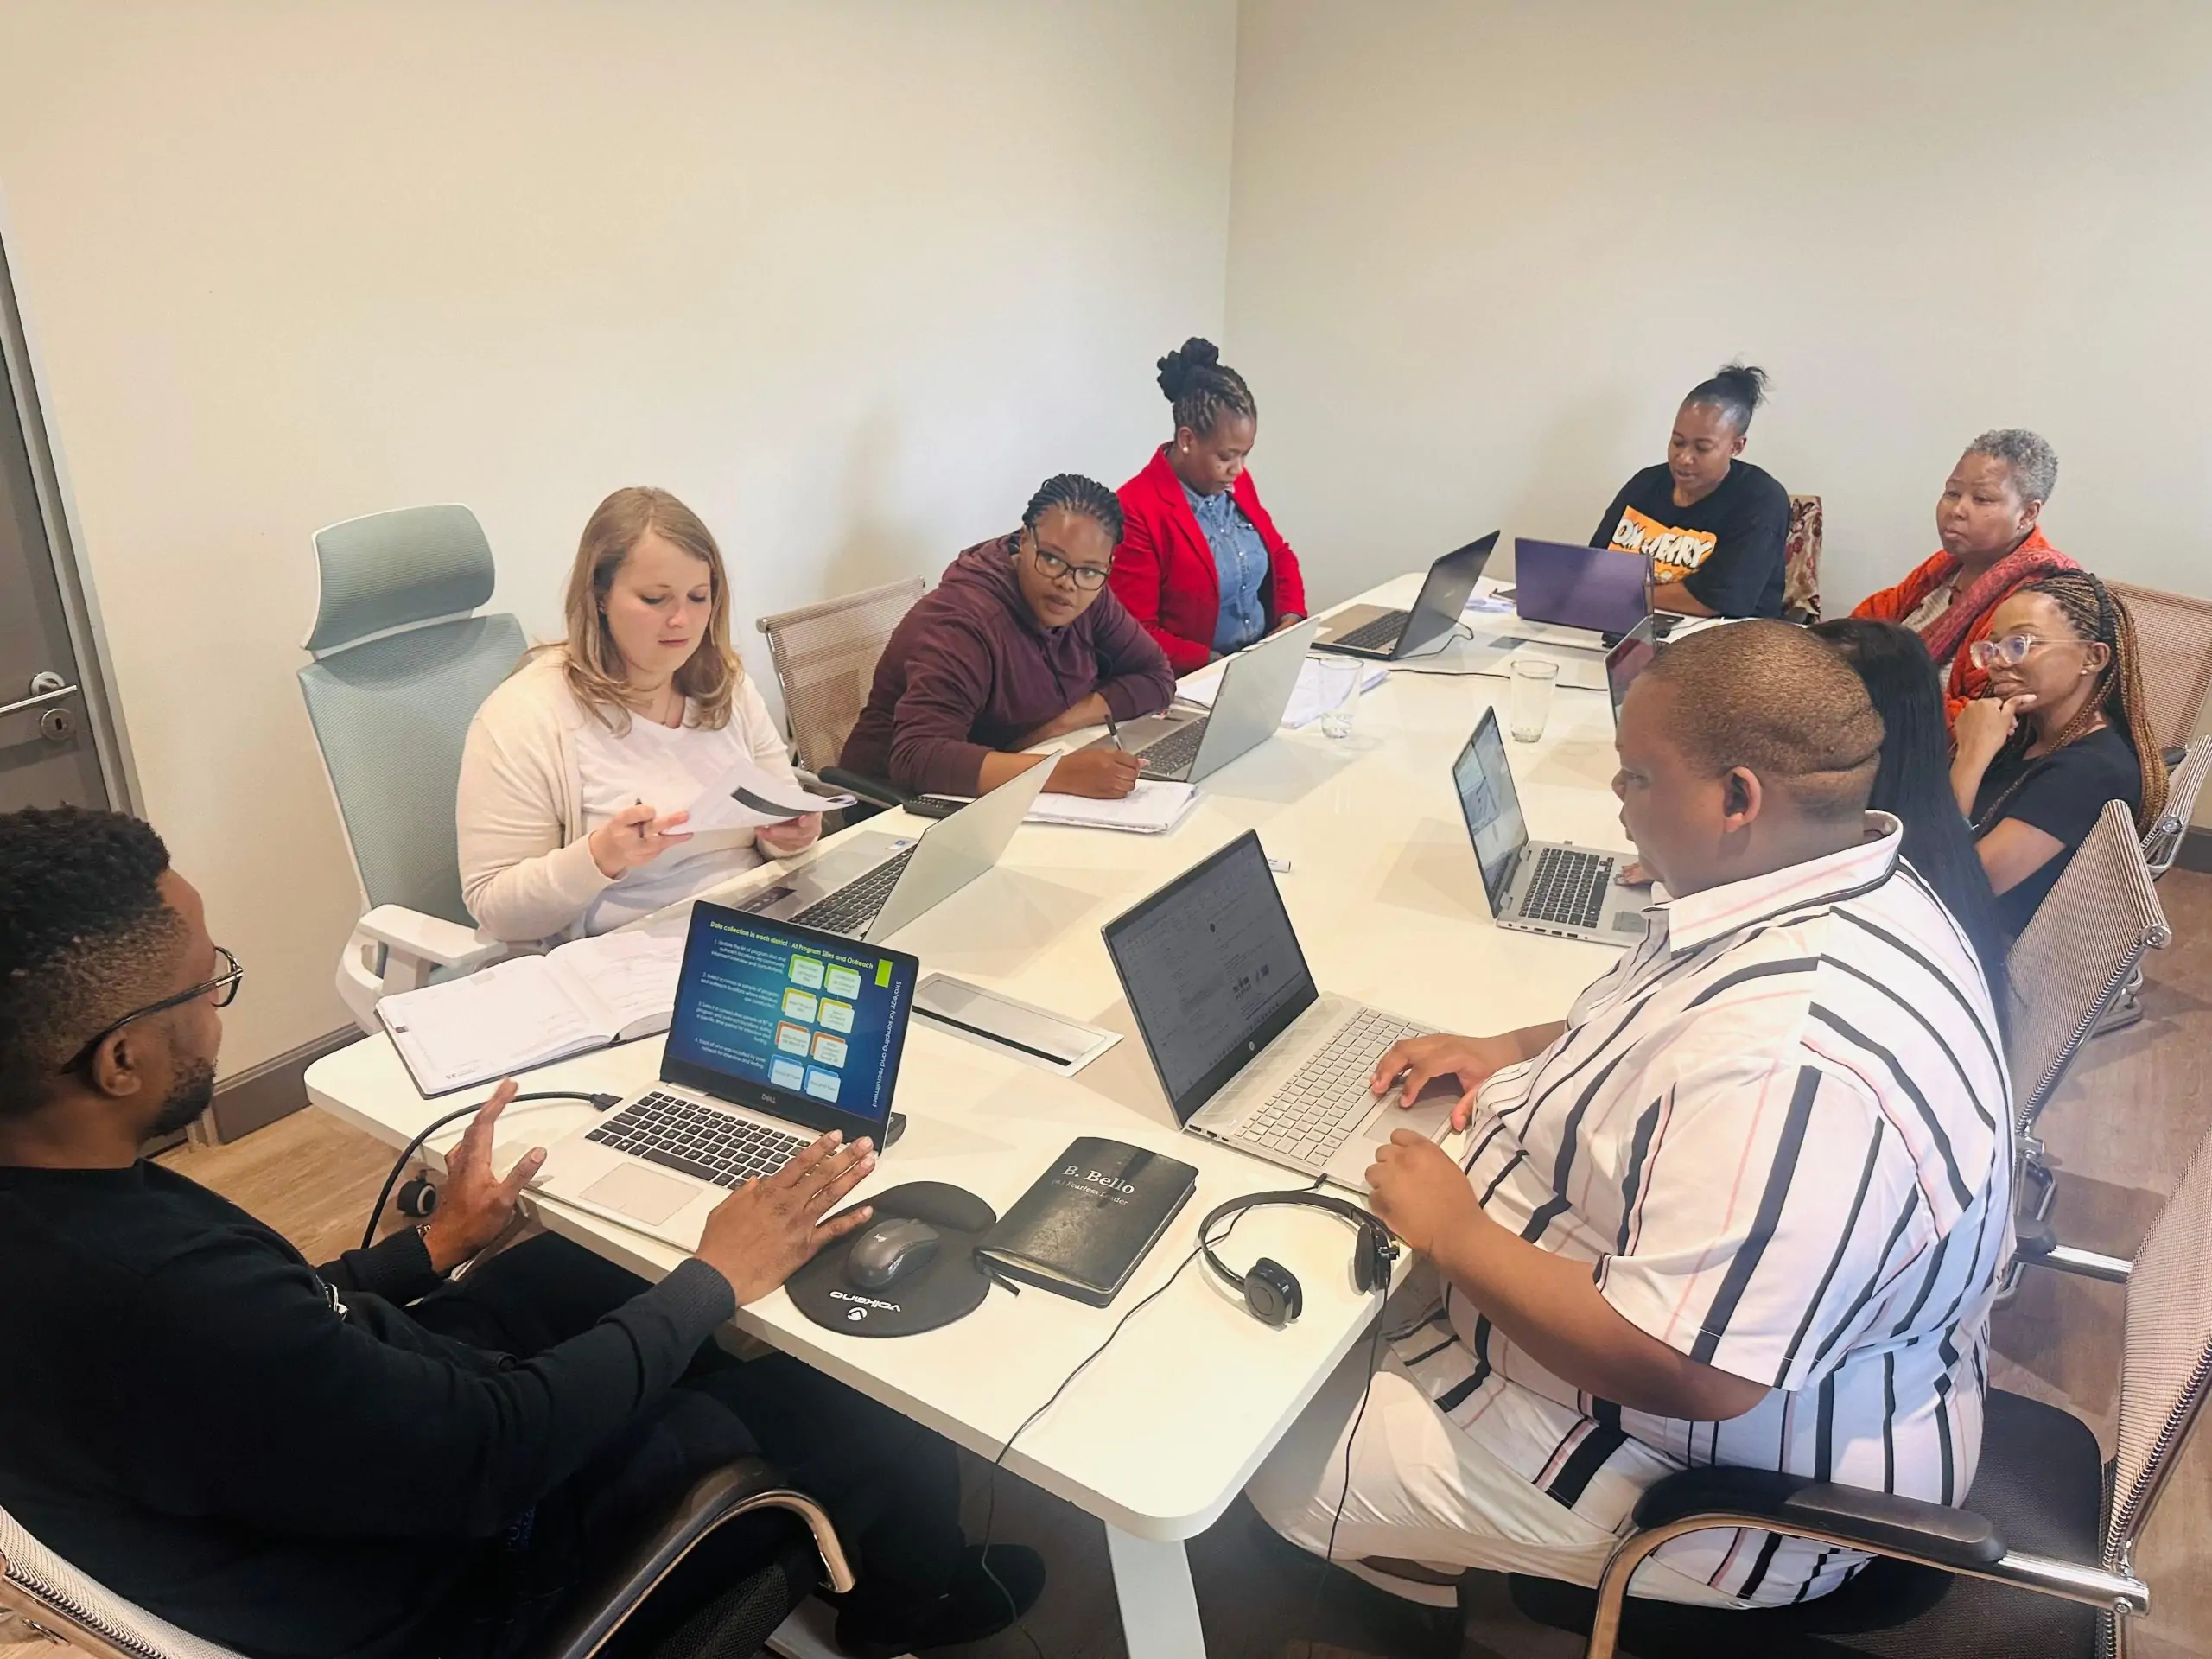
Need training for your staff, students or organisation? Contact CESAR to discuss your objectives, preferred delivery format and training needs.
Discuss Institutional TrainingInterested in an upcoming course? Register your interest and reserve a place. You can indicate your preferred learning mode and location.
Explore Upcoming CoursesEvery course we offer. Any of them can be delivered for your team, or you can register your interest in the next cohort.
Data Analytics & Visualisation
Go beyond basic Excel. Turn raw data into clear analysis and dashboards in 3 weeks of live, practical sessions.
Learn MoreData Analytics & Visualisation
Manage, describe and analyse your data confidently in Stata.
Learn MoreData Analytics & Visualisation
Import, clean, visualise and report on data with R and RStudio.
Learn MoreData Analytics & Visualisation
Turn data into interactive dashboards people can explore.
Learn MoreData Analytics & Visualisation
Fit, diagnose and interpret regression models for causal questions in Stata.
Learn MoreData Analytics & Visualisation
Learn the core statistical methods behind sound research.
Get NotifiedData Analytics & Visualisation
Build, check and report linear, logistic and Poisson regression models in R.
Get NotifiedResearch Methodology
Take a study from research question to synthesis, with quantitative and qualitative methods.
Learn MoreResearch Methodology
Design rigorous quantitative studies, from protocol to critical appraisal.
Learn MoreResearch Methodology
Design, conduct and analyse qualitative research with confidence.
Learn MoreResearch Methodology
Do a systematic review end to end, through to meta-analysis.
Get NotifiedMonitoring & Evaluation
Close the gap between collecting data and using it to make decisions.
Learn MoreDigital Data & AI
Design digital data collection tools and work confidently in DHIS2.
Get NotifiedDigital Data & AI
Map health data in QGIS and communicate what the maps show.
Get NotifiedDigital Data & AI
Build and deploy practical AI-powered applications.
Get NotifiedReporting & Communication
Structure and write research reports that present findings clearly.
Learn MoreReporting & Communication
Write concept notes and funding proposals that are ready to submit.
Get NotifiedBootcamps
Go from research question to a finished proposal, with guidance on publishing.
Get NotifiedBootcamps
Learn end-to-end data analytics with Excel, SQL and Python.
Get NotifiedSee what's coming up, then register or tell us you're interested.
24 Nov – 10 Dec 2026 | Tue, Thu, Fri | 8 sessions
Individual courseLive on Zoom
25 Nov – 12 Dec 2026 | Wed, Sat, Sun | 8 sessions, 20 hours
Individual courseLive on Zoom
5 Jan – 22 Jan 2027 | Tue, Thu, Fri | 9 sessions, 18 hours
Individual course
Designed for organisations and institutions
In-person or online
Dates from January 2027 are provisional and may change. Times are confirmed when registration opens.
Tell us what skills you want to develop or what training your organisation needs. We'll be happy to discuss a suitable programme.